Performance KPIs
At the top of the Analytics dashboard, six high-level metrics give you an immediate snapshot of your platform’s performance based on your selected date range:Total Calls
The absolute volume of inbound and outbound calls processed. Use this to gauge overall platform utilization.
Total Minutes
The aggregate number of voice minutes consumed. Check your billing page or contact sales for per-minute rates.
Success Rate
The percentage of calls where the agent successfully completed its objective. Low success rates may indicate prompt issues or tool misconfiguration.
Avg Duration
The average length of your conversations. Shorter isn’t always better — the right duration depends on your use case.
Active Agents
The number of unique AI agents that fielded calls during the selected period.
Sentiment
The overall average sentiment (positive/neutral/negative) of your callers, determined by AI post-call analysis.
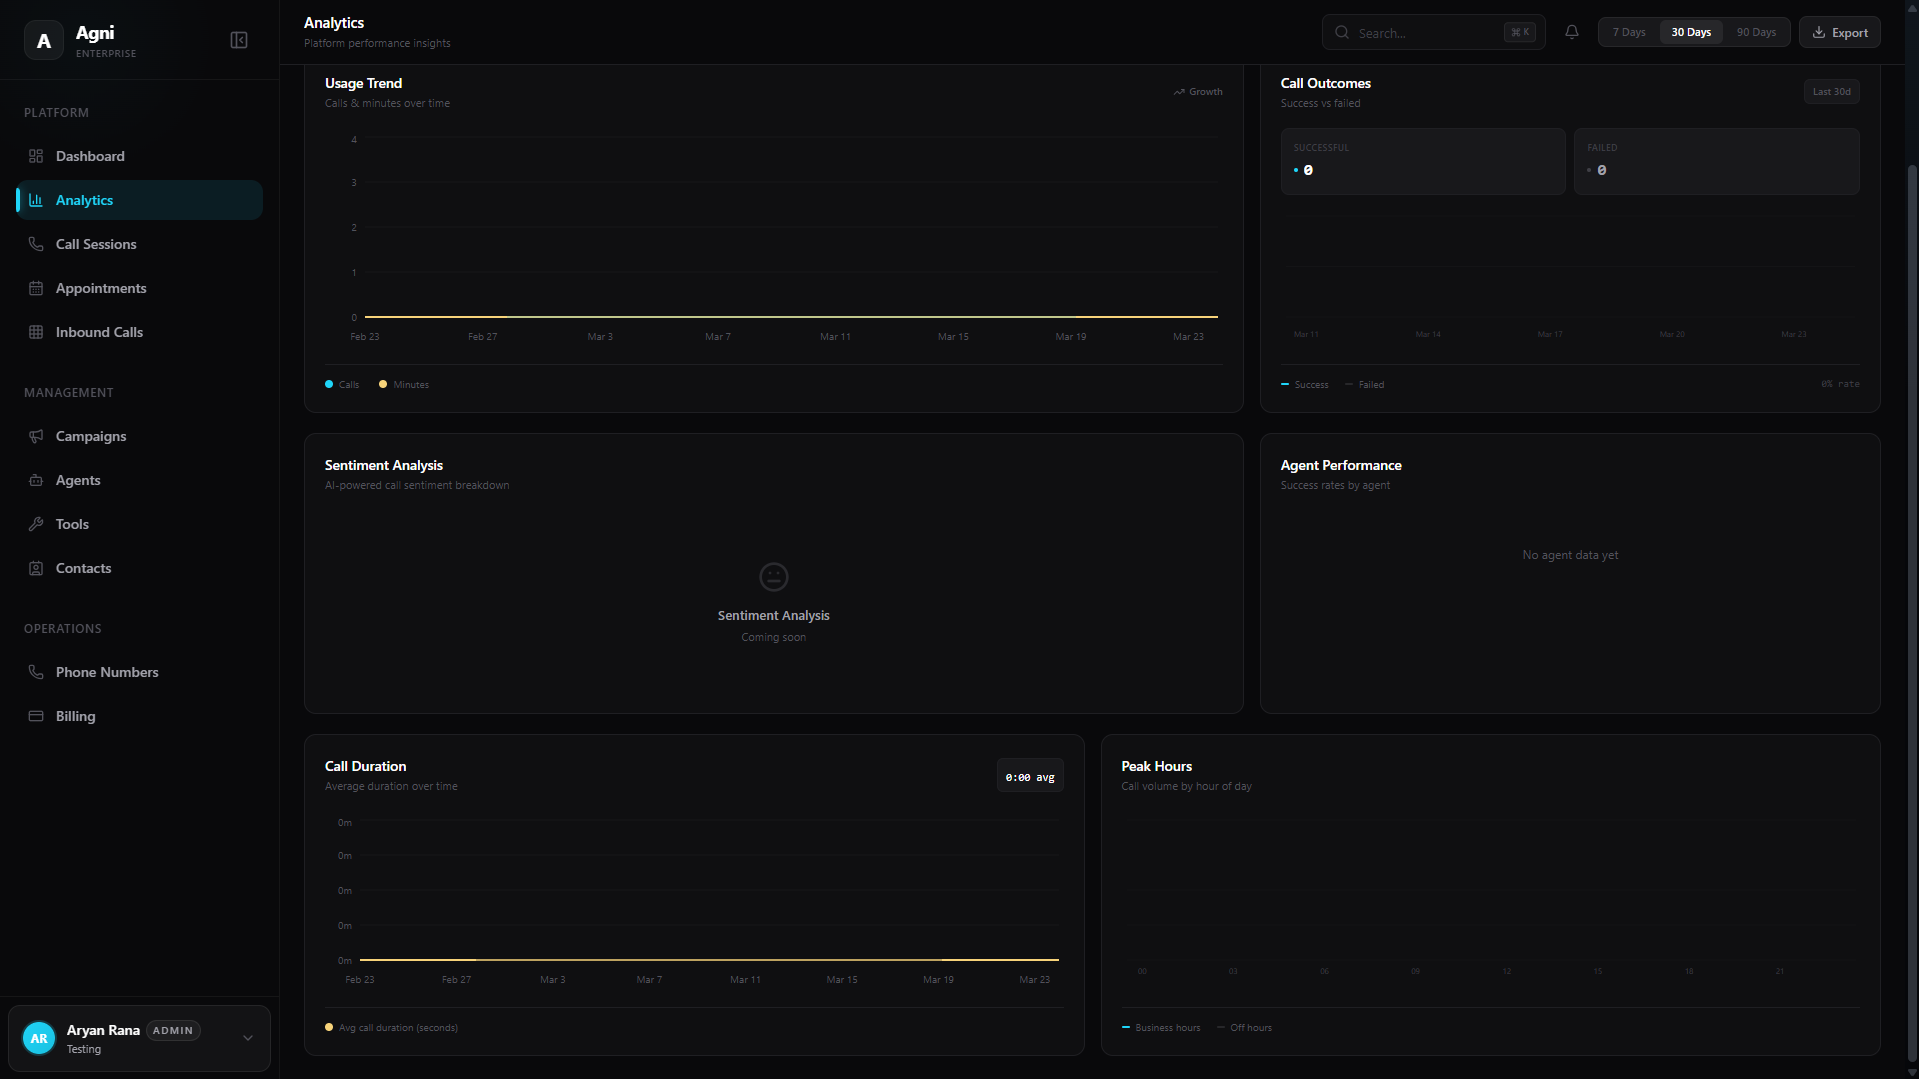
Visualizations & Trends
Agni provides a powerful suite of interactive charts to help you visualize data trends and optimize your agents’ performance.Usage Trend
Tracks calls and minutes over time. This chart directly correlates to your platform spend. Look for unexpected spikes or drops.
Call Outcomes
A comparative breakdown plotting Successful versus Failed calls. A rising failure rate often signals routing issues, prompt problems, or integration errors.
Sentiment Analysis
An AI-powered breakdown of caller sentiment based on conversational analytics. Use this to measure customer satisfaction without post-call surveys.
Agent Performance
Compares success rates across different agent deployments. Use this to A/B test system prompts, voices, or tool configurations and find your best-performing setup.
Call Duration
Plots your average call duration over time. Sudden increases may indicate agents getting stuck in loops; sudden drops may mean agents are ending calls prematurely.
Peak Hours
Visualizes call volume by hour of the day, split between Business hours and Off hours. Use this to plan concurrency needs and staffing.
What to Look For
Success rate dropping
Success rate dropping
Check your agent’s system prompt and tools first. A common cause is tool descriptions that are too vague, causing the AI to trigger actions at the wrong time. Review recent call transcripts in the Call Sessions page.
Average duration increasing
Average duration increasing
This could mean agents are struggling to reach their objective and conversations are dragging. Or it could mean your agents are handling more complex queries — context matters. Check the call transcripts to understand.
Negative sentiment trending up
Negative sentiment trending up
Review the Call Sessions detail view for recent calls with negative sentiment. Common causes: agent interrupting the caller too aggressively, incorrect information, or failure to resolve the issue.
Unexpected cost spikes
Unexpected cost spikes
Check the Usage Trend chart for volume anomalies. If calls increased but were unintended, review your dispatch rules and campaign settings. Also check for long-running calls that hit the max duration limit.
Filtering and Exporting Data
In the top right corner of the dashboard, you can control the scope of your analytics:Filter by Date
Use the quick-select pills (7 Days, 30 Days, 90 Days) or the date picker to recalculate your dashboard metrics for a specific timeframe.
Tip: Set a weekly cadence to export and review your analytics. Tracking trends over time is more valuable than looking at any single day’s numbers.